IFT Tourism Research Centre (ITRC) is releasing quarterly results of the Macao Tourism Satisfaction Index, covering the third quarter of 2012. Existing subscribers will be emailed copies of the reports directly. ITRC has been collecting quarterly data on visitor satisfaction in Macao since 2009 and its database now span results covering more than three years. Highlights of the latest findings are as follows.
Visitor satisfaction in Macao—slight but continuous improvement developing
Figure 1 - Satisfaction Index, 2009 Q3 to 2012 Q3
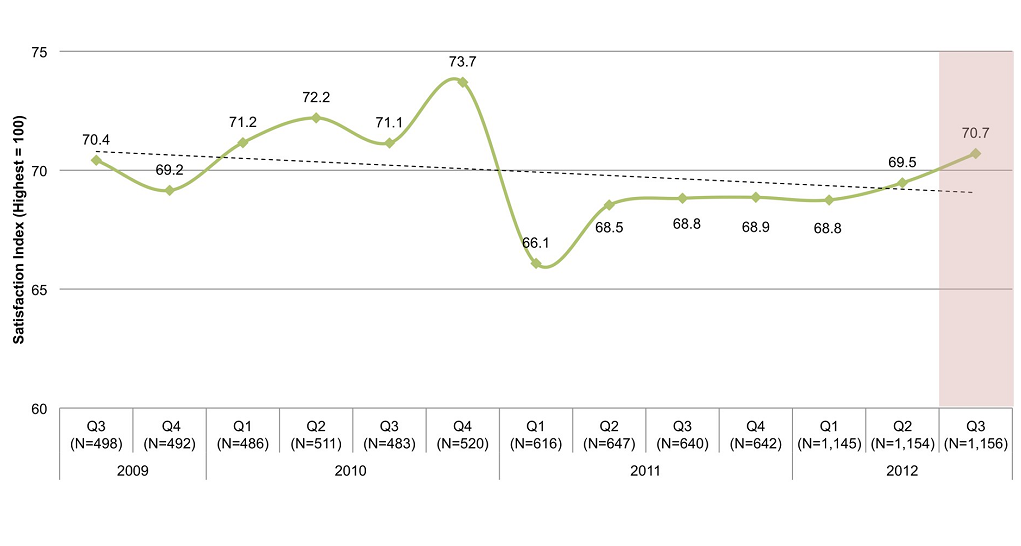
As of the end of the 3rd quarter of 2012, the Tourism Satisfaction Index (TSI) for Macao stood at 70.7 our of a highest score of 100. See Figure 1. This is slightly better than the 69.5 recorded in the 2nd quarter of 2012 and is the first time the ‘psychological ceiling’ of 70 has been surpassed. The last time the MTSI was above the 70-mark was in Q4 2010. The overall long-term trend, nevertheless, continues to point slightly toward declining overall satisfaction. The most recent result continues a slight but improving short-term trend for 2012. However, it is early to say whether 2012 will end in an overall positive territory.
The events sector holds up overall visitor satisfaction; big declines in satisfaction for heritage attractions and restaurants
Figure 2 - Sectoral TSI performance, Q3 versus Q2 2012

Macao’s events remains the most significant sector boosting overall visitor satisfaction. Comparing satisfaction results of the latest quarter with the second quarter, there were slight improvements for the transport and hotel sectors but significant declines in reported satisfaction in the heritage attraction and restaurant sectors. See Figure 2. Tour guides and operators, retail shops and non-heritage attractions also did not fare well, reporting declines in satisfaction. the biggest quarterly improvement was recorded in the immigration sector.
The long term trend shows casinos, hotels and transport to be improving; but this is counterbalanced by four sectors with declining or stagnating visitor satisfaction
Figure 3 - Sectoral TSI, Q2 2009 to Q3 2012

Looking at the sustained performance of all sectors over the last thirteen quarters, Macao’s events sector remains the most consistent positive performer, with visitor satisfaction for this sector being sustained above average. See Figure 3. Casinos, hotels and most significantly, the transport sector are showing ongoing, though slight, improvements. Improved results recorded by the restaurant sector last Q2 proved temporary. Overall, therefore, Macao has 3 sectors improving (casinos, hotels and transport) but 4 are showing trends toward declining or long-term stagnation in visitor satisfaction: Heritage and non-heritage attractions, restaurants, retail shops, and tour guides/ operators.
About the MTSI
Every quarter since 2009, ITRC has been measuring the level of visitor satisfaction in Macao across various sectors. Results across all sectors are averaged to form an overall Macao Tourist Satisfaction Index (MTSI). The ten tourism sectors in the TSI include (a) casinos, (b) events, (c) heritage attractions, (d) hotels, (e) immigration services, (f) non-heritage attractions, (g) restaurants, (h) retail shops, (i) tour guides/ operators, and (j) transportation services. With similar studies conducted by partners in other countries, results obtained in Macao are compared, when available, with those obtained in Hong Kong, Singapore, Shenzhen, and other destinations for comparing performance and competitive benchmarking.
Methodology
The MTSI is measured using a field survey in which respondents are selected and interviewed based on a systematic random sampling technique. Interviews with visitors are conducted at major tourist sites and transport terminals in Macao. Around 1,150 interviews are conducted quarterly. The TSI is an index comprised of the average responses to three questions: Overall satisfaction, performance compared with expectations and with ideal performance with results transformed and reported on a scale ranging from 0- to 100-points. The higher the score on the index, the higher the level of satisfaction. The overall TSI is the average of all ten sectoral TSIs.
For more information
Please contact Ms. Virginia Hong or Ms. Wendy Tang of ITRC at itrc@ift.edu.mo.